Internal reporting for Meteor apps
Bringing back the paper trail
Recently, we’ve been building applications that handle a lot of actions. Orders created, items dispatched, users allocated - the kind of things that would produce a long paper trail when handled offline. While moving these jobs online drastically speeds up users’ day-to-day work, it also means that those records can be lost. After all, if you don’t need to physically pass a requisition slip from one desk to another in order to get something done, what record of it should exist at all?
That’s all well and good if your end goal is to save the trees but that same data is invaluable when you want to look back on past performance, gauge efficiency, and make predictions for the future. Because every organisation is different (and developers are lazy), whatever solution we come up with has to be flexible enough to meet any number of use cases. That means it should be simple to flag an event or action to be logged and store it in the format that’s most useful and easy to handle in large quantities.
Using our recent work with delicious & healthy-food purveyors, Pelico, I started digging into out of the box solutions. I hit upon Mixpanel and fell in love with their simple approach to logging events.
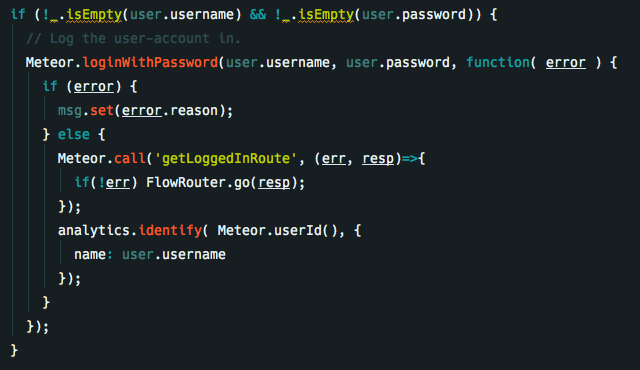
Easy! Just identify a data point (in this case a Meteor user), send it off to Mixpanel (via analytics.identify()), and wait for it to start triggering. Once it does, you can follow that user around the app, attach additional events to their profile, and start to build a picture of their behaviour. Of course, you shouldn’t ever just straight up stalk your users, even if they work for you, but it’s useful to highlight key actions - like what time an order comes in versus what time it leaves HQ - to identify potential bottlenecks and room for improvement.
The problem with Mixpanel and other off-the-shelf analytics packages is that they’re largely focused on public-facing services. If you run an online store and want to see where customers are getting bored and bouncing off your site, it’s perfect. However, we need something more basic and customisable to get the insights we’re looking for.
One graf to rule them all
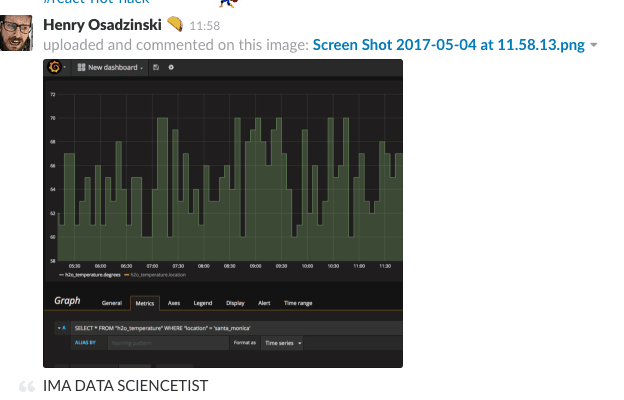
Enter Grafana - an open-source, time series analytics platform that can draw from a huge range of different sources. What that means is that, provided every action we log comes with a timestamp (and preferably some other quantifiable data point as well), Grafana can bundle them all up into some seriously useful (and pretty!) charts.
Its other big benefit is that it opens up to a completely blank slate. Beyond the all-important timestamps, it doesn’t make any assumptions about the type of data that you’re about to cram down its insatiable maw. This takes care of our other major want - flexibility. Large datasets typically get more interesting as they get bigger. It’s crucial to be able to adapt to new inspiration and ideas as trends start to emerge. With Grafana, we should be able to set how big (or small) a picture we want to take in, contrast and compare different data points, and build new reports as additional needs are identified. And by “we”, I mean “data scientists with more training than me”.
The trouble with Mongo
Now that we know where our data is going, we need to figure out how to send it on its journey. While it’s tempting to keep it in our current Meteor stack and rely on MongoDB, there are a few problems with this approach. While Mongo will hold onto most anything you ask it to persist, it isn’t particularly well suited to handling time series data. That and the fact that we ideally want to keep our app and logging concerns separate so as not to end up with one very bloated database means that we’ll be splitting off and going with another solution - InfluxDB.
Storing records by time is Influx’s bread and butter, so it’s a perfect data source for our event logs. We’ll be passing data to it via Telegraf, which is capable of parsing various data formats and converting them into useful metrics for Influx to grow into some wonderfully big data.
Where next?
We want all of this work to take place completely separate from our application so it will sit in its own stack and receive data over a basic logging API. After a shaky start with Etsy’s StatsD, that last piece is yet to be determined. As we want this system to be as unobtrusive and portable as possible, the end goal is to have logging as simple as that first Mixpanel event, to keep our core app code clean and readable.
That might require rolling our own library, depending on the level of control that we need over the data being sent across.
Watch this space!
References
- https://mixpanel.com
- https://grafana.com
- https://www.influxdata.com
- https://github.com/influxdata/telegraf
- https://codeascraft.com/2011/02/15/measure-anything-measure-everything/