React Native Debugger + Expo = AWESOME
Recently the web developers at Gravitywell have been getting more interested in writing mobile apps.
Previously this has always been the realm of native app developers, writing in native languages like Java and Swift: React Native changes all that. We can now write apps in Javascript that can then compiled into native code. The clever people at Facebook created React Native to open up the native app work to JS developers, meaning we can now actively create native apps and not some crappy web wrapper excuse for one.
The set up for a react native app can be a little off putting as it is not the most straightforward. It also requires you to have either Xcode or Android studio installed so that you can run their respective simulators. Enter Expo. This will allow you to build native apps using their Xde framework and APIs and makes things far easier. I don’t need to waste time giving you a tutorial on how to install and use expo, as their documentation is excellent. Instead we’re going to discuss a development and debugging experience that is second to none!
Coming from a web development background, I’ve become accustomed to the fast feedback loop of developing in the browser with the awesome Chrome developer tools. This allows for easy debugging in the console and permits you to inspect the DOM elements on your page. When developing React Native apps you still have this but with reduced functionality. You still have the console, but not the ability to inspect elements and change their styles. This is where the React Native Debugger comes in. This was a game changer for me. It allows you to inspect elements in your apps and change the styles on the fly. It’s amazing! The issue however was it didn’t seem to play nicely with Expo.
How much easier would it be if these two could work harmoniously together? Well luckily there is a way!
How can this be done?
Make sure you have Expo and the React Native Debugger(RND) installed. Both sites have detail installation instructions, so it should not be difficult to get those fired up.
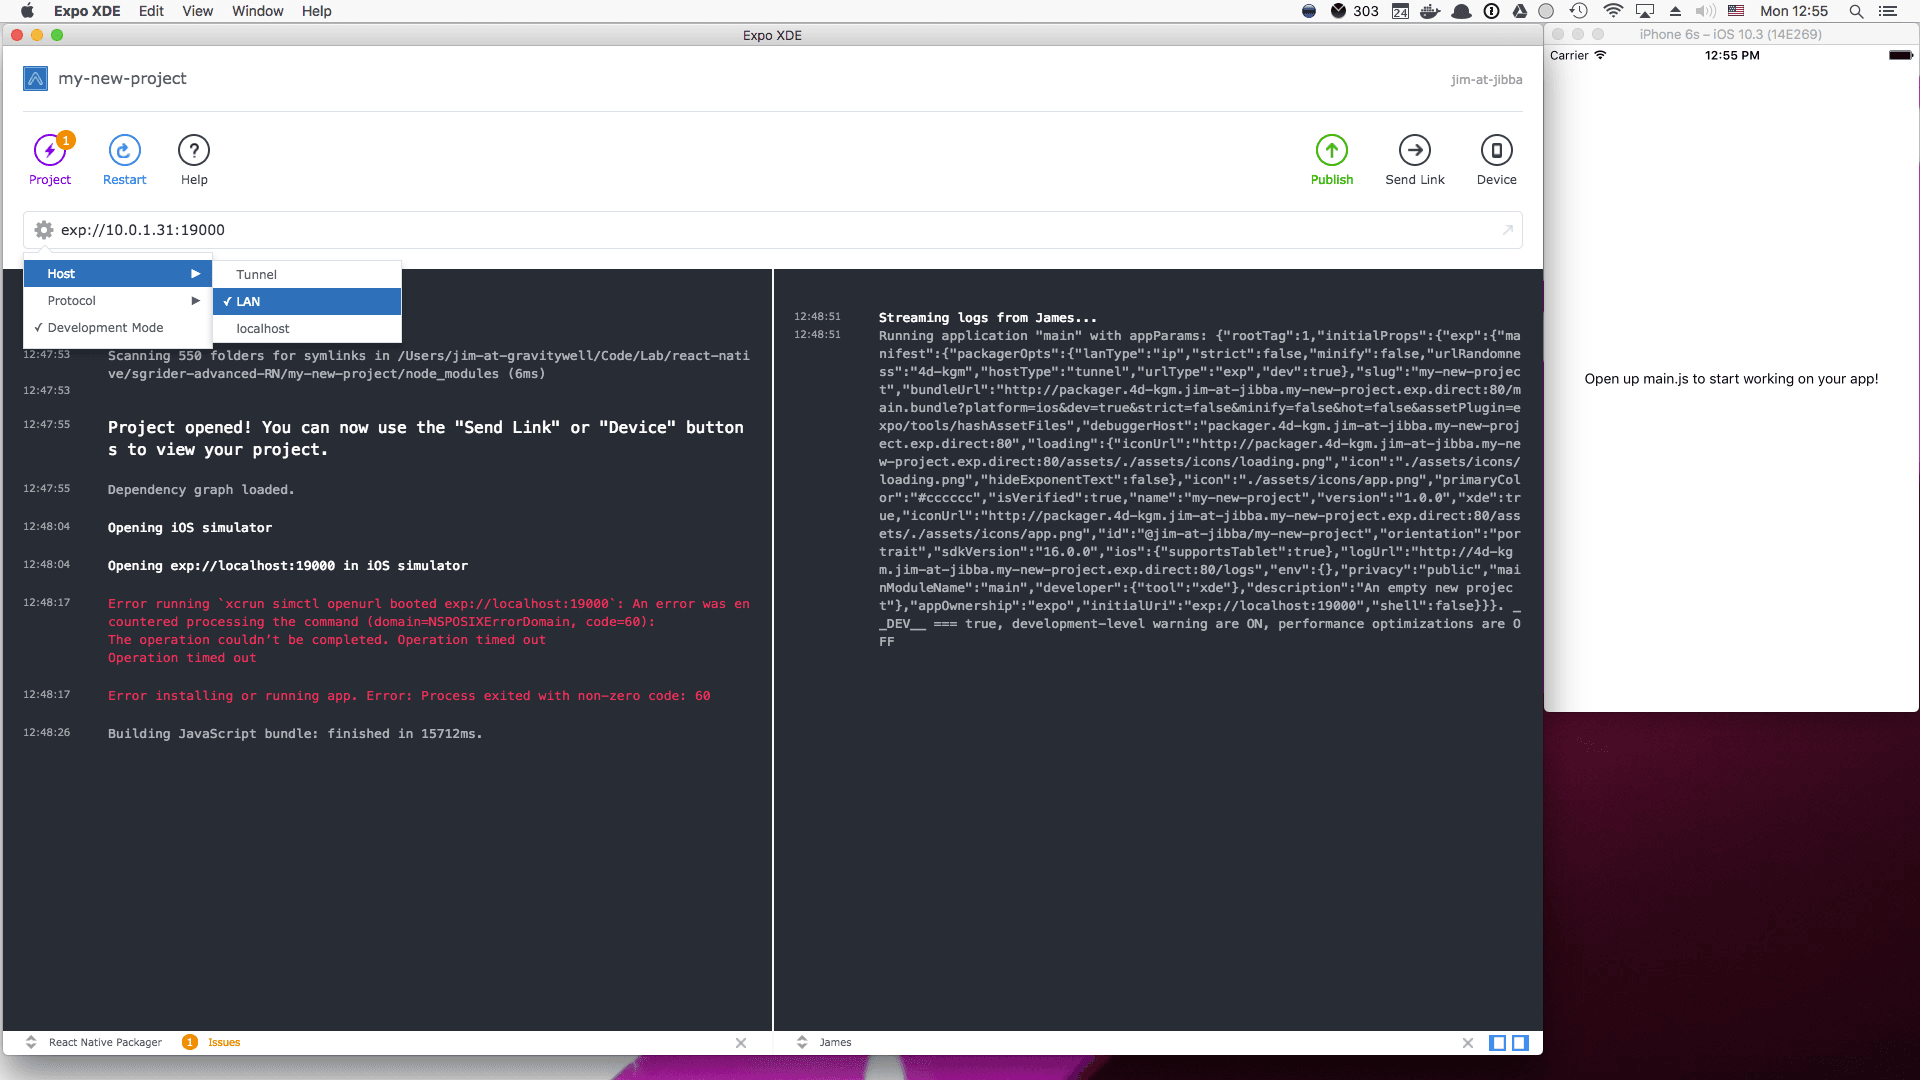
Create a new project in Expo and get it running. You should be greeted with something that looks like this:

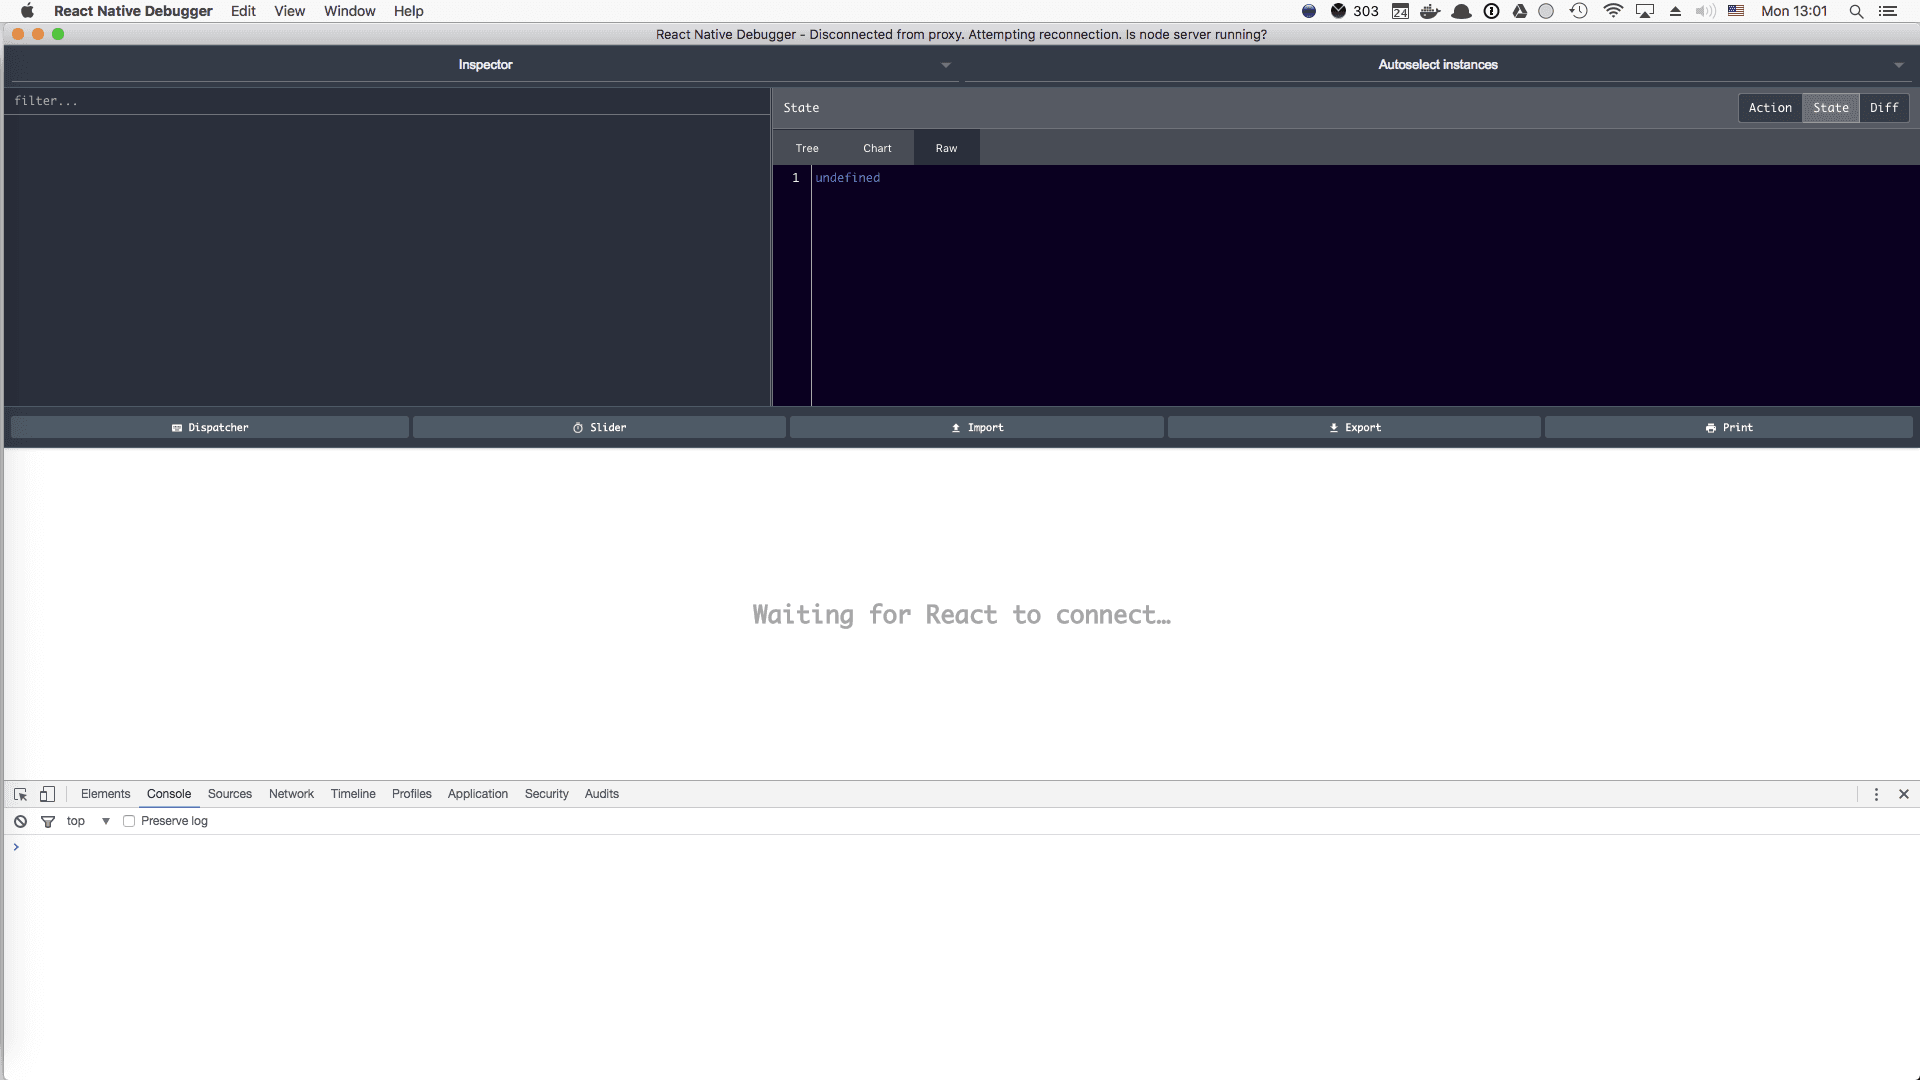
Now if you open the RND, you will not see any debug info. This is because the standard React Native CLI runs the debugger on localhost:8080.
Expo on the other hand, does things a little differently. To allow live development on a device (a benefit to Expo) it runs the packer and debugger by different means. It runs the app in a tunnel that allows a direct connection to the app through the Expo app. To get RND to work we need to change how the apps connect to Expo. It’s worth mentioning that RND will only work with the Simulator and not directly on the device. Although that’s not to say you can't have it running on the device and the simulator at the same time. Double awesome.

In the expo address bar there is a code icon. If you click it you will be greeted with a dropdown of options. Click the host menu item and select LAN. This will connect the app and Expo via your local network. This has the added bonus of far quicker hot code pushes if you have a crappy internet connection. You need to enable the debugger in the simulator. This can be done by accessing the debug menu (Ctr+Cmd+z). This then opens the standard JS debugger that you will be used to. But take a look at the URL - notice the port is different. Expo runs the debugger on port 19001. We need to get RND to use this port instead.
Kill the running instance of the debugger and open your terminal.
open "rndebugger://set-debugger-loc?host=localhost&port=19001"
This will open the debugger on the specified port. Now activate remote debugging in the app again and you should be good to go. This now gives you very similar tools to developing in the browser with Chrome. You have access to the console as you would with the normal debugger, but you also have the ability to inspect elements, search for components by name and change their styles on the fly!
To do most of this you will need to enable 'Element Inspector' in the simulator, but then any element you select in the simulator will show in RND. See the video below for a quick demo. It’s freaking awesome!